How to cite The BioClock Studio
Bioluminescent and fluorescent reporters in circadian rhythm studies
Takako Noguchi and Susan Golden
*This review article assumes basic knowledge of gene expression and light wavelengths
Abstract
Various organisms create fascinating “glow-in-the-dark” proteins in nature. Scientists introduce these special proteins into organisms that they study and use the emitted light to report where, when, and how much genes or proteins of interest are expressed. Two major kinds of reporters, luciferases and fluorescent proteins, are often confused with each other because they have common characteristics: (1) they can be used to make it easy to track the expression of genes or proteins of interest by fusing a reporter gene to a gene of interest (genetically encoded reporters), and (2) they glow in the dark. However, there are fundamental differences between these reporters. Generally, luciferases, which catalyze a reaction with a substrate luciferin and generate light as a product (bioluminescence), are dim, but highly quantitative reporters and suitable to measure how much and when a gene or protein is expressed. Fluorescent proteins, which require an external light source to stimulate emission of a different wavelength of light, are bright reporters and suitable to locate in which cells a gene is activated or where in a cell a protein is expressed. In this review, we introduce basic mechanisms of bioluminescence and fluorescence, and how they are used in circadian rhythm research.
 Entry Level;
  Intermediate Level;
  Advanced Level
Published on March 22 2017, Last modified on March 22 2017
Mechanisms to glow in the dark
As you study biological science, you encounter experiments using “bioluminescence” and “fluorescence.” Both bioluminescence and fluorescence appear as specimens glowing in the dark. However, the light is generated by different mechanisms. Bioluminescence is generated by chemical reactions, whereas fluorescence is the re-emission of transformed light that was absorbed by a substance at a different wavelength. In other words, bioluminescence can glow by itself like stars, but fluorescence needs an external light source to glow, like the moon needs the sun to shine. In this section, we will introduce the mechanisms that generate bioluminescence and fluorescence.
Bioluminescence
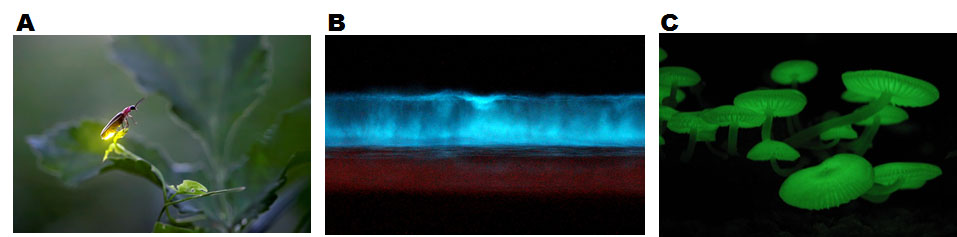
Figure 1. (A) Firefly (genus species unidentified) emitting yellow bioluminescence. (B) A tide glowing in blue by bioluminescence created by unicellular plankton, dinoflagellates. (C) Bioluminescent mushrooms (Mycena chlorophos).
[Attribution and copyright information: (A) This picture is copyrighted by Radim Schreiber , whose permission is required for any usage. (B) This picture was cropped from a picture taken by Mike at Carlsbad, CA. CC BY-SA 2.0 (C) Lalalfdfa. CC BY-SA 3.0.]
Bioluminescence is light emitted by living organisms. Bioluminescent organisms are found in most branches of the evolutionary tree, including bacteria, fungi, invertebrates, and vertebrates (Oba and Schultz, 2014) (Fig. 1). Organisms use bioluminescence for various activities, such as mating, attracting prey, and escaping from predators (Oba and Schultz, 2014). The bioluminescence is generated by chemical reactions involving an enzyme, luciferase, and a substrate (a small chemical molecule), called luciferin (Shimomura, 2006). There is no similarity in the sequence of luciferases or chemical structures of luciferins of organisms in different taxa, suggesting that bioluminescence was reinvented multiple times in evolution. However, there is one common mechanism that generates bioluminescence: a luciferase catalyzes oxidation of a luciferin using molecular oxygen as a substrate (Wilson and Hastings, 1998). The reactions are well studied in some organisms, such as fireflies (Shimomura, 2006) (Fig. 2), but in some organisms, such as mushrooms, the bioluminescence reactions are not understood well (Oliveira et al., 2012; Purtov et al., 2015).
Bioluminescence can be emitted in complete darkness through chemical reactions. Bioluminescence is very dim compared to sun light or room light and usually occurs in naturally dark environments, such as at night or in the deep sea.
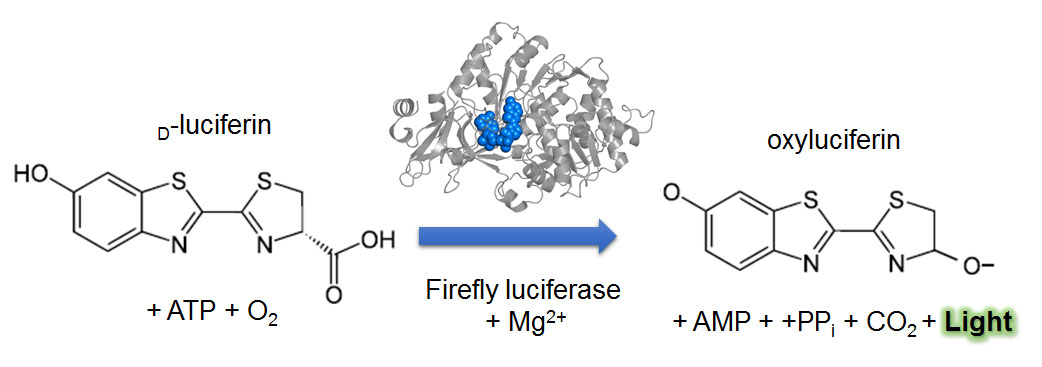
Figure 2. Luciferin-luciferase reaction in firefly. Light emitting reaction requires D-luciferin, adenosine triphosphate (ATP), and oxygen (O2). A luciferase and a cofactor (Mg2+) catalyze the reaction to generate oxyluciferin, adenosine monophosphate (AMP), pyrophosphate (PPi), carbon dioxide (CO2), and light.
[Attribution and copyright information: D-lucifein, Yikrazuul, Public domain; oxylucifein, modified from Yikrazuul’s D-lucifein by Takako Noguchi, Public domain; Crystal structure of firefly luciferase was obtained from Protein Data Bank in Europe, Sundlov et. Al, Biochemistry (2012) (Sundlov et al., 2012), Terms of Use.]
Fluorescence
Fluorescent substances absorb a higher energy (or shorter wavelength) of light and emit light at a lower energy (or longer wavelength) (Fig. 3A). The higher energy light absorbed by a fluorescent substance is called excitation light. The re-emitted light is called fluorescence (Lichtman and Conchello, 2005). Because wavelengths of emitted and excitation light are different, we can filter out excitation light so that only the fluorescence is visible (Wilson and Hastings, 1998) (Fig. 3B). Thus, fluorescence appears to be glowing in the dark because of light filtration, but the light does not originate with the fluorescent material.
Fluorescent compounds are called fluorophores. At the atomic level the energy of excitation light is absorbed by an electron of a fluorophore, causing it to move to a higher energy (excited) state. As the electron returns to the lower energy (ground) state, the energy difference between states is released as light (fluorescence) (Fig. 3C). Because a part of the energy is lost during this process, the wavelength of fluorescence is longer than that of the excitation light. For example, blue excitation light turns into green, and yellow light becomes red. This transition of energy states is also the basis of emission in bioluminescence, although the energy that excites an electron is supplied by chemical reactions in bioluminescence. Thus, bioluminescence is fluorescence in a strict physics definition. However, in the biological field, scientists conventionally distinguish bioluminescence and fluorescence by the source of energy that excites an electron, which is a chemical reaction (oxidation of luciferins) in bioluminescence and external excitation light in fluorescence. This distinction dramatically affects the design of experiments.
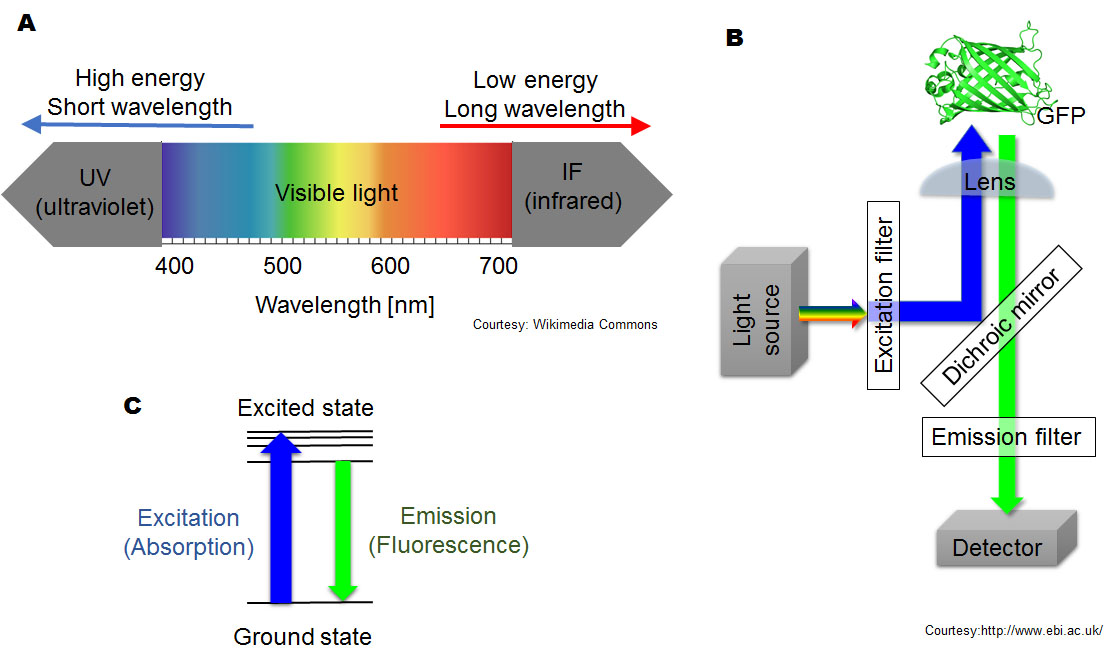
Figure 3. Basics of fluorescence. (A) Spectrum of visible light. White light consists of light with a wide range of wavelengths. Photons related to shorter wavelengths (violet and blue) have higher energy than longer wavelengths (orange and red). (B) Filtering fluorescence. A light source sends a broad range of light. An excitation filter selectively passes the wavelength that is absorbed by a fluorescent compound. In this case, blue excitation light is used for green fluorescent protein (GFP). A dichroic mirror reflects and passes selective wavelengths of light. In this case, it reflects blue light and passes green light. An emission filter selectively passes the wavelength of the fluorescence: this case, green light from GFP. Finally, filtered fluorescence is captured by a detector. (C) Generation of fluorescence at the atomic level. Excitation light moves an electron to an unstable excited state. An excited electron instantaneously relaxes and returns to ground status, emitting fluorescence as the difference in energy between the two states, with some energy lost to entropy.
Attribution and copyright information: (A) Picture was modified by Takako Noguchi based on Philip Ronan’s, CC BY-SA 3.0 (B) Crystal structure of GPF was obtained from Protein Data Bank in Europe, Arpino JAJ, et. al, Biol. Crystallogr. (2014) (Arpino et al., 2014), Terms of Use. The other part of diagram was created by Takako Noguchi. CC BY 4.0. (C) Picture was created by Takako Noguchi. CC BY 4.0.
Fluorescence is emitted by various substances including natural minerals and synthetic chemical compounds. Fluorescence generated by organisms (biofluorescence) can be derived from fluorescent proteins, such as the green florescent protein (GFP) found in jellyfish (Aequorea Victoria) (Shimomura et al., 1962; Shaner et al., 2005) or small molecules generated by or consumed by organisms (Gandia-Herrero et al., 2005). Biofluorescence is found in various organisms including bacteria (Drepper et al., 2007), corals (Matz et al., 1999), flowers (Gandia-Herrero et al., 2005), butterflies (Vukusic and Hooper, 2005), fish (Sparks et al., 2014), and birds (Arnold et al., 2002) (Fig. 4). Some biofluorescence is thought to have ecological advantages. For example, it protects corals by transforming harmful ultraviolet (UV) to lower energy light (Salih et al., 2000), or attracts insects for pollination in flowers (Gandia-Herrero et al., 2005). However, there are many substances in organisms that fluoresce without obvious ecological reasons, such as heme in red blood cells, and riboflavin, a vitamin.
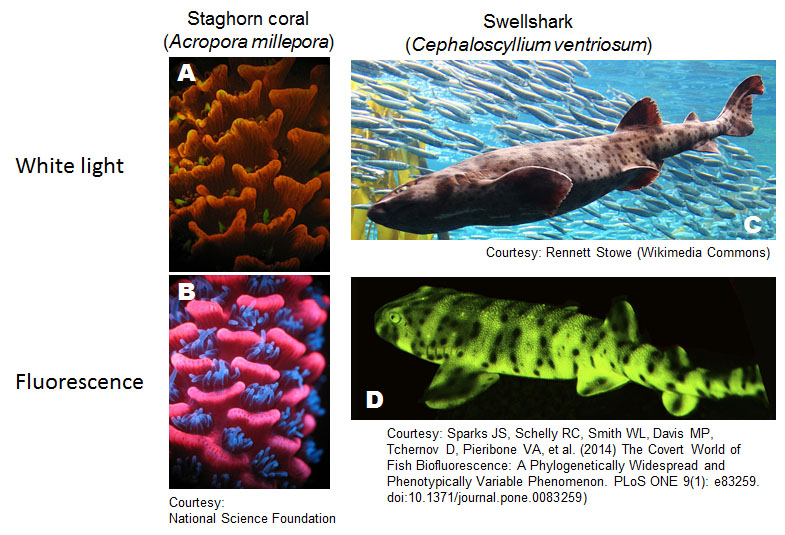
Figure 4. Biofluorescence in marine animals. (A-D) A coral and shark with or without fluorescent lighting conditions.
Attribution and copyright information: (A-B) Mikhail Matz, University of Texas, Joerg Wiedenmann, National Oceanography Centre, Southampton, National Science Foundation, Conditions of use. Link to source of A and B. (C) The picture was cropped from Rennett Stowe’s, CC BY-SA 2.0. (D) The picture was cropped from figure 1 of Sparks et al. 2014 (Sparks et al., 2014), CC BY 4.0.
Characteristics of bioluminescent and fluorescent reporters
Genetically encoded reporters, such as luciferases and fluorescent proteins, are powerful tools to detect expression of genes and proteins. By connecting a reporter gene to the promoter or coding sequence of a gene of interest, scientists can tell where, when, and how much the gene or protein is expressed. Generally, fluorescent protein reporters are suitable to locate in which cell or tissue the gene is activated or where in a cell the protein is expressed. Luciferases are suitable to quantify how much and when the gene is expressed, but are usually not sufficiently bright for pinpointing where the light is coming from. In this section, we introduce characteristics of bioluminescent and fluorescent reporters.
Evaluating gene expression by reporters
In the biological field, the word “gene expression” is often used to describe transcriptional activity, including promoter activity and mRNA level, but it can also include protein level as well. The DNA sequence of a gene is transcribed into RNA, which is then translated into a protein. A promoter located upstream of a gene is the DNA sequence that directly controls the amount of transcription (affecting mRNA level), and indirectly controls the amount of translation (protein level). Thus, the combination of promoter activity, mRNA level, and protein level contribute to overall gene expression (Adams, 2010). Scientists can evaluate promoter activities – the frequency of a transcript arising from a promoter – by measuring the signal from a reporter that is transcribed/translated under control of the promoter, or can monitor the protein product by a signal from a fusion protein made up of the protein of interest fused directly to a reporter protein. However, mRNA levels are generally measured by other molecular biology techniques, such as q-RT-PCR (quantitative real-time polymerase chain reaction), and RNA sequencing.
Bioluminescent reporters
Bioluminescent reporters, also referred to as luciferase reporters, have advantages for quantifying the expression level of genes and proteins. The characteristics that make luciferases more quantitative reporters than fluorescent proteins are the following. (1) Low background. Bioluminescence recording is performed in complete darkness by a light detector. There is virtually no background noise because the luciferin-luciferase reaction is the only light-emitting reaction in cells and tissues. Because of this low background, luciferase reporters allow detection of a lower level of gene expression than fluorescent proteins (Choy et al., 2003). (2) Large dynamic range. Dynamic range refers to how low and high a reporter can quantify a variable and still be linear (i.e., the range where light emission accurately reflects the amount of material being measured). A light detector can measure more than 108-fold changes in the amount of luciferase (Promega Corporation, 2000). (3) Adequate instability. Real-time increases and decreases of gene expression in living cells cannot be measured with highly stable reporter proteins because of accumulation of residual reporters. It is important that reporters are degraded when the gene is not being actively transcribed and the message translated. Stability of proteins is indicated by half-life, the time taken for proteins to drop in amount to half of the original level. The half-life of wild-type GFP is about 26-54 h depending on the conditions (Sacchetti et al., 2001; Kitsera et al., 2007). In contrast, the half-life of firefly luciferase is about 3-4 h (Leclerc et al., 2000). Thus, luciferase is typically better for circadian studies, to be able to detect one trough before a gene turns back on in the next cycle. To faithfully report rapid changes of gene expression, there are cases where the half-life of luciferase is further shortened by addition a destabilization sequence, such as a “PEST” sequence (ProGluSerThr), promoting proteolysis (Leclerc et al., 2000).
A disadvantage of luciferase reporters is the dimness of the light. Bioluminescence is commonly detected by photomultiplier tubes (PMT), a type of light detector that is capable of amplifying the signal of photons (Hamamatsu Photonics KK, 2006). In many applications in circadian rhythm studies PMTs detect summed bioluminescence from all samples in a tube or a plate. In this case, luciferase reports quantity or temporal gene and/or protein expression (how much or when the gene or protein is expressed), but not spatial information. It is possible to capture spatial information (where the light is coming from) by luciferases, but it requires high-end detectors, such as super-sensitive cooled CCD (charge-coupled device) camera, or a CCD camera with a photon enhancement function (Welsh and Noguchi, 2012). These bioluminescent images taken by high-end detectors carry all quantity, temporal, and spatial information. But the spatial resolution for bioluminescent images is much courser than fluorescent images. For example, bioluminescent images can only visualize the shape of a single eukaryotic cell, but fluorescent images can visualize down to the organelle level (Figs. 5-6).
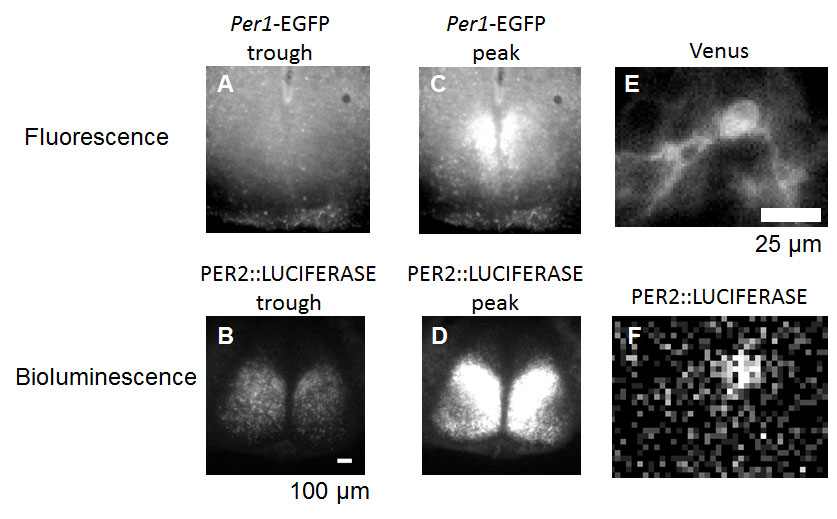
Figure 5. Spatiotemporal clock gene or protein expression quantified from neonatal mouse suprachiasmatic nucleus, SCN. (A, C) Representative images of Period1(per1) promoter activity reported by destabilized Enhanced Green Fluorescent Protein, EGFP (Per1-EGFP) (Kuhlman et al., 2000) around expression trough (A) and peak (C). (B, D) Representative images of PERIOD2 (PER2) protein level reported by a luciferase (PER2::LUC) around expression trough (B) and peak (D). Note the higher background in fluorescence images than bioluminescent images. (E-F) Single SCN neurons expressing both fluorescent protein (E) and a luciferase (F). Yellow fluorescent protein, Venus, was introduced into dispersed SCN neurons of PER2::LUC mice. Note the higher spatial resolution in fluorescent images than in bioluminescent images.
[Attribution and copyright information: (A-F) Pictures were taken by Takako Noguchi in Dr. David Welsh’s laboratory. CC BY 4.0. The PER2::LUC mouse was generated by Dr. Joseph Takahashi while at Northwestern University (Welsh et al., 2004). The Per1-EGFP mouse was generated by Dr. Douglas McMahon while at the University of Kentucky (Kuhlman et al., 2000). We thank Drs. Takahashi and McMahon for their generous donation of these mouse lines.]
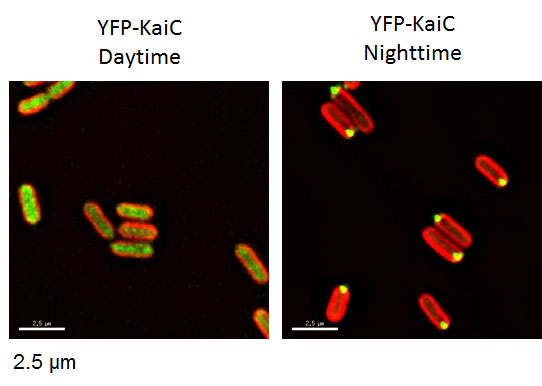
Figure 6. Time-dependent localization of KaiC, a clock protein of cyanobacteria, was studied in cyanobacteria expressing a fusion protein of KaiC and YFP (Cohen et al., 2014) by fixing samples at various time points of a day. YFP-KaiC and autofluorescence from the cell’s photosynthetic machinery are displayed in green and red, respectively. Example of repeated one-timepoint protein localization in cyanobacteria.
[Attribution and copyright information: These pictures were taken by Dr. Susan E Cohen in Golden’s laboratory. CC BY 4.0.]
Fluorescent protein reporters
Fluorescent proteins have advantages for visualizing the location of a protein in a cell (termed subcellular localization). The characteristics that make fluorescent reporters more suitable for visualization of location than luciferases are the following. (1) Brightness of the light signal. Because fluorescence is bright, scientists can magnify cells and observe structures inside of cells, such as the nucleus or other organelles. (2) Color variations. There are many color variants in fluorescent proteins (Shaner et al., 2005). Scientists can express multiple genes that encode fluorescent proteins of different colors in a cell, fused to different proteins of interest, at the same time and study where the different proteins are expressed in the cells (termed co-localization). (3) Site-specific excitation. It is possible to excite fluorescent proteins in a very small area of tissue or cells using a laser beam. Confocal and two-photon laser scanning microscopy (Zipfel et al., 2003; Conchello and Lichtman, 2005) are high-end fluorescent microscopy techniques that “erase” out-of-focus fluorescence from the background by exciting a point of a sample with a focused laser beam and generating 2-D or 3-D images by scanning. Especially, two-photon laser scanning microscopy enables the visualization of fluorescent signals in thicker specimens, such as brain tissue (>500 µm) in a living mouse by using a laser with a longer wavelength (Peters et al., 2014). In the circadian rhythm field, daily changes in neuronal activity have been monitored in the zebrafish brain (Appelbaum et al., 2010), the fly brain (Bushey et al., 2015), and in a marine annelid (Tosches et al., 2014) using calcium sensors based on fluorescent proteins that we will introduce later in this article.
Disadvantages of fluorescent proteins are: (1) Photobleaching. Fluorophores are damaged by photons and lose the ability to fluoresce. Photobleaching is problematic in real-time imaging, in which reporters are repeatedly exposed to excitation light to observe the pattern of expression over time (Giloh and Sedat, 1982; White and Stelzer, 1999). (2) Phototoxicity. When fluorophores are exposed to light, especially of higher energy, the process tends to generate reactive oxygen species (ROS), extremely reactive molecules that can damage DNA, RNA, and proteins by oxidization (Dixit and Cyr, 2003; Godley et al., 2005). This phototoxicity also complicates applications of fluorescent protein reporters to live-cell imaging. (3) High background. Because cells and organisms contain compounds that naturally fluoresce (exhibit autofluorescence), signals from fluorescent proteins have to be high enough compared to autofluorescence to rise above the background (Niswender et al., 1995; Shaner et al., 2005) or have to be different enough in wavelength from autofluorescence to be separated by filtration (Fig. 6). Fluorescence imaging in plant cells or other photosynthetic organisms, such as cyanobacteria, is especially challenging because photosynthetic pigments, such as chlorophyll, exhibit high levels of autofluorescence (Zhang et al., 2010). But fluorescence imaging can be performed by choosing filters specifically designed to block the transmission of autofluorescence wavelengths (Cohen and Golden, 2015). (4) High stability. GFP is a very stable protein (Sacchetti et al., 2001; Kitsera et al., 2007). Stability of proteins is advantageous to visualize localization of proteins, but problematic for measuring dynamics of expression level because pre-existing proteins continue to accumulate. Thus, you can’t tell how much “new” protein was made at a particular time. Quantification of gene expression is possible with fluorescent proteins by including degradation sequences into the reporter protein that recruit the cellular proteolysis machinery, shortening half-life.
Applications of bioluminescent and fluorescent reporters in circadian rhythm studies
Luciferase and fluorescent protein reporters are used widely in circadian rhythm studies for various purposes. The selection and design of reporters are different depending on the purpose of each experiment. To understand the experimental results in a paper or presentation better, it will be helpful for students to consider if the reporter is representing activity of a promoter or expression of a protein, spatial and/or temporal information, and activity in live or fixed cells. In this section, we summarize representative use of luciferase and fluorescent protein reporters in experiments and introduce examples of applications of each case in circadian rhythm research.
Application flow chart
The first check point (Fig. 7A) to evaluate the experiment is to determine if the reporter is luciferase or a fluorescent protein. Luciferase reporters are mostly used to quantify gene or protein expression level. On the other hand, fluorescent proteins are mostly used to locate where the gene or protein is expressed rather than quantifying the expression level.
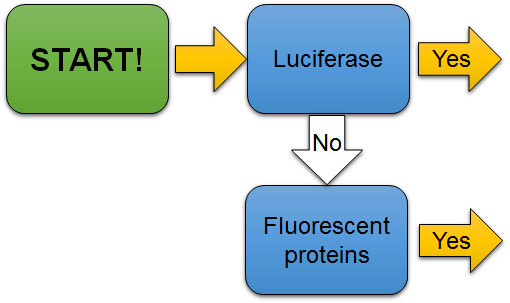
Figure 7A. The first check point to evaluate the use of reporters in experiments. Is the reporter luciferase or a fluorescent protein?
[Attribution and copyright information: This diagram was generated by Takako Noguchi. CC BY 4.0.]
The second check point (Fig. 7B) is whether the reporter gene is directly connected to a promoter of a gene or designed to create a fusion protein with a protein of interest. Both promoter fusions and protein fusions may be used with both kinds of reporters (Fig. 8). If the coding region of the luciferase reporter gene alone is directly connected to the promoter of the gene of interest, bioluminescence level represents promoter activity (Fig. 8A). In other words, it reports how frequently the promoter turns on and causes an mRNA to be transcribed. But the mRNA that is translated into a protein is just the luciferase, not the protein that is usually controlled by that promoter. Thus, this type of reporter predicts mRNA levels of the gene of interest, but does not provide information about quantity or functions of the protein of interest that the gene normally controls.
Alternatively, a fusion protein can be created by attaching the codons of a luciferase gene seamlessly to the codons from a gene of interest, such that when a ribosome reads the resulting mRNA, it will insert all of the amino acids for one protein and start putting in the amino acids for the next, all in one polypeptide. For example, in Fig. 8A the promoter and codons for per2 are fused seamlessly to codons of the luciferase gene. The resulting protein is a fused product, in which the protein of interest and the luciferase reporter are both present and attached to one another – in this case, PER2::LUC. When luciferase is physically fused to a protein of interest, the bioluminescence level represents the level of the protein of interest as well as of the reporter, because they are part of the same molecule (Fig. 8A). The luciferase reporter will be degraded together with the fused protein of interest.
The same sorts of fusions can be made with genes for fluorescent proteins (Fig. 8B), and the light emitted from a fluorescent protein is usually bright enough to make a distinct spot. With a promoter fusion, the fluorescent protein is usually expressed in the cytosol and visualized as the shape of an entire cell in which the promoter is activated, such as both the cell body and neural processes of a subset of neurons in a fruit fly brain. However, sometimes it is important to also know where in the cell a protein of interest goes (subcellular localization information), which cannot be provided by the promoter for a gene. When subcellular localization information is desirable, the reporter protein needs to be physically attached to the protein of interest, so that they move together. Subcellular localization of a protein is controlled by short amino acid sequences (localization signals) that guide a protein to a certain cellular compartment or to be secreted out of the cell. Commonly used reporter proteins have no localization signal of their own, and just stay in the cytoplasm after it being translated by the ribosomes. However, when the codons for a fluorescent reporter gene are fused to those for a protein of interest (Fig. 8D), localization signals in the protein of interest bring the attached reporter protein along for the ride to a specific subcellular location (Fig. 6, 8D).
![]() Advanced concept: Both luciferase and fluorescent protein reporters can be engineered to be expressed in only specific cells of a multicellular organism using methods in which the reporter gene is silent unless a cell-type-specific signal turns it on, such as the GAL4-UAS system used commonly in fruit fly (Brand and Perrimon, 1993), and the Cre-Lox recombination system used in mice and other eukaryotes (Sauer, 1998). In these cases, the expression of reporters can be indirectly controlled by a particular promoter, and it is necessary to look carefully at the details to find out what is controlling the expression of the reporter.
Advanced concept: Both luciferase and fluorescent protein reporters can be engineered to be expressed in only specific cells of a multicellular organism using methods in which the reporter gene is silent unless a cell-type-specific signal turns it on, such as the GAL4-UAS system used commonly in fruit fly (Brand and Perrimon, 1993), and the Cre-Lox recombination system used in mice and other eukaryotes (Sauer, 1998). In these cases, the expression of reporters can be indirectly controlled by a particular promoter, and it is necessary to look carefully at the details to find out what is controlling the expression of the reporter.
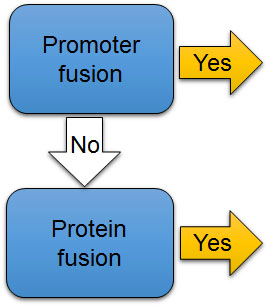
Figure 7B. The second check point to evaluate the use of reporters in experiments. Is it the reporter promoter fusion or protein fusion?
[Attribution and copyright information: This diagram was generated by Takako Noguchi. CC BY 4.0.]
The third check point (Fig. 7C) is to determine whether the reporter signal was collected from fixed (immobilized) cells, in which the live activity of cells is arrested, such as by cross-linking (fixing) protein structures with formalin (Nakagawa et al., 2015), or from living cells, tissues, or organisms where transcription and translation are still occurring. When scientists use fixed cells, the results of experiments do not convey temporal information. However, scientists can take samples in a time series and fix cells from each time point to convey temporal information. When reporter expression is monitored continuously from the same living cells, tissues, or organisms, the results of experiments convey temporal information directly, showing dynamic changes in expression of the gene or protein of interest in real time.
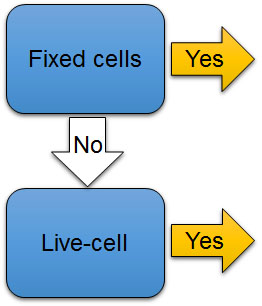
Figure 7C. The third check point to evaluate the use of reporters in experiments. Are samples fixed cells or live-cells?
[Attribution and copyright information: This diagram was generated by Takako Noguchi. CC BY 4.0.]
The 4th check point is to determine whether the data were collected as a summed output (added up total of signal) from a whole population of cells or tissues, or imaged at the single-cell level (Fig. 7D). Luciferase reporters can be analyzed both ways. Fluorescent protein reporters are analyzed from images. Summed output from a population conveys temporal and quantity information, but not spatial information. But with images, scientists can analyze detailed cellular or spatial events. Using fluorescent reporters fused to proteins of interest, scientists can analyze subcellular- or organelle-level localization of the proteins. (Keep in mind that localization signals are parts of proteins, and a promoter can’t tell a reporter where to go in the cell after it is made.)
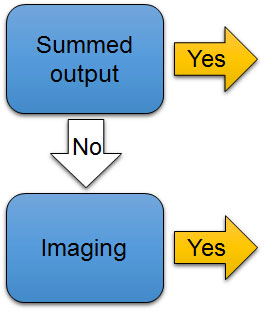
Figure 7D. The 4th check point to evaluate the use of reporters in experiments. Are data summed outputs or images?
[Attribution and copyright information: This diagram was generated by Takako Noguchi. CC BY 4.0.]
The last check point to consider is whether the reporter is destabilized or not (Fig. 7E). Luciferases are naturally unstable compared to fluorescent proteins, and they are often destabilized further to increase temporal resolution. Fluorescent proteins are generally not destabilized, because accumulation improves ability to visualize localization of proteins. However, it is possible to quantify promoter activity using fluorescent proteins if they are destabilized.

Figure 7E. The 5th check point to evaluate the use of reporters in experiments. Is the reporter destabilized or not?
[Attribution and copyright information: This diagram was generated by Takako Noguchi. CC BY 4.0.]
Once you have evaluated check points discussed above, you can understand the use of reporters in experiments by following the entire flowchart (Fig. 7). Determine whether the reporter is representing quantity and/or location, activity of a promoter or level of a protein, and activity in live or fixed cells.
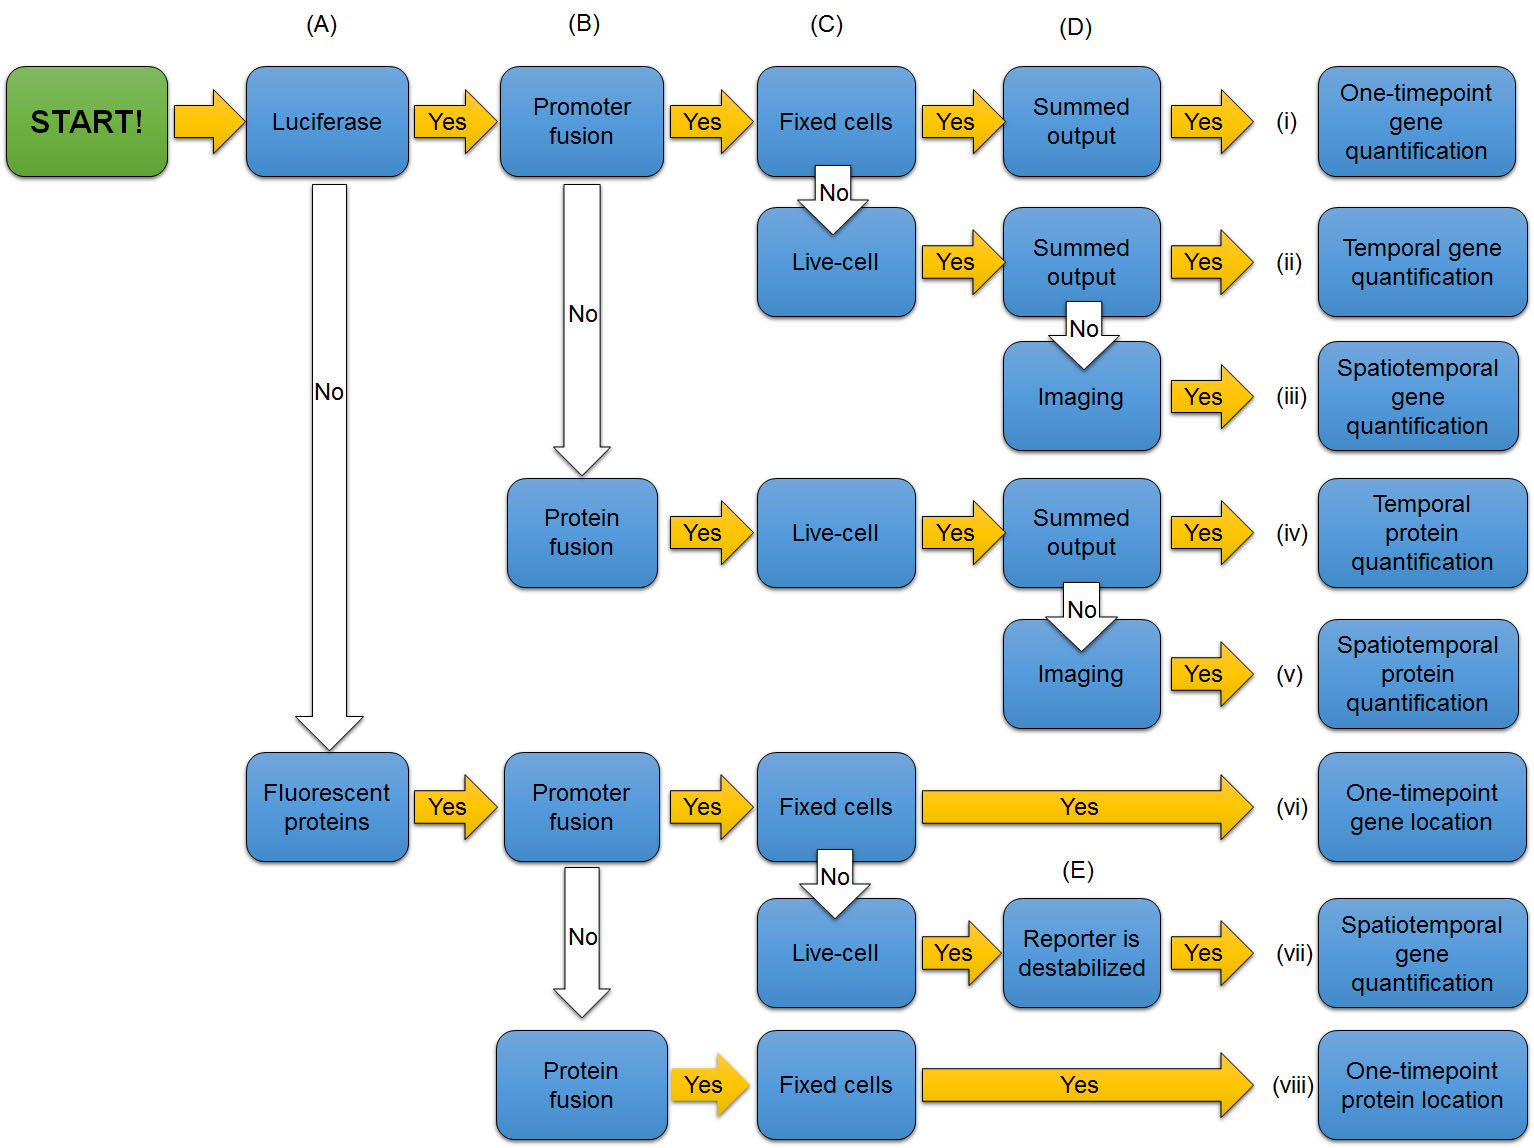
Figure 7. Flowchart to tell the use of reporters in experiments from the design of genetically encoded reporters and key features of experiments.
[Attribution and copyright information: This diagram was generated by Takako Noguchi. CC BY 4.0.]
Examples of applications in circadian rhythm research
One-timepoint gene expression quantification
The best example of one-timepoint gene expression quantification (Fig. 7i) is a promoter-fusion assay that tests the functions of specific sequences within promoters or the interaction of transcription factors with promoters. Luciferase reporters are widely used in promoter assays in many types of biological science as well as circadian rhythm research. In the circadian rhythm field, for example, the E-box, a transcription factor-binding site, was shown to be important for rhythmic Period gene expression in Drosophila (Darlington et al., 1998) and in mouse using luciferase promoter assays (Gekakis et al., 1998).
Temporal gene expression or protein quantification
In the circadian rhythm field, scientists often use luciferase to quantify temporal changes of clock gene expression. Clock genes encode molecular components that generate circadian rhythms, and most of these genes increase and decrease in expression level over the course of the day (Mohawk et al., 2012). Luciferase was first applied as a reporter to monitor circadian oscillation in expression of a gene in living Arabidopsis plants (Millar et al., 1995). In cyanobacteria, a luciferase reporter was used to find the core clock genes (Kondo et al., 1993; Kondo et al., 1994). In mice, timing of accumulation of some clock proteins is delayed several hours relative to mRNA expression (Morse and Sassone-Corsi, 2002) (Fig. 8A-B). This difference can be studied by measuring transcription (promoter fusion) and protein levels (protein fusion) over time using luciferase (Fig. 7ii, iv). For example, to compare transcription and translation levels of Per2, scientists generated two mouse lines: one expressing a luciferase coding sequence under control of Per2 promoter elements, and the other expressing a luciferase fused to PER2 protein (PER2::LUC mouse) by fusing their coding sequences together in the correct reading frame (Yoo et al., 2005) (Fig. 8A-B). They cultured the SCN, which is a master circadian pacemaker of mammals located in the hypothalamus, monitored luciferase activity in real time over a week (Yoo et al., 2005), and demonstrated a delay of several hours in luciferase peaks from the promoter fusion (transcriptional fusion reports Per2 mRNA transcription) and the protein fusion (translational fusion reports PER2 protein levels).
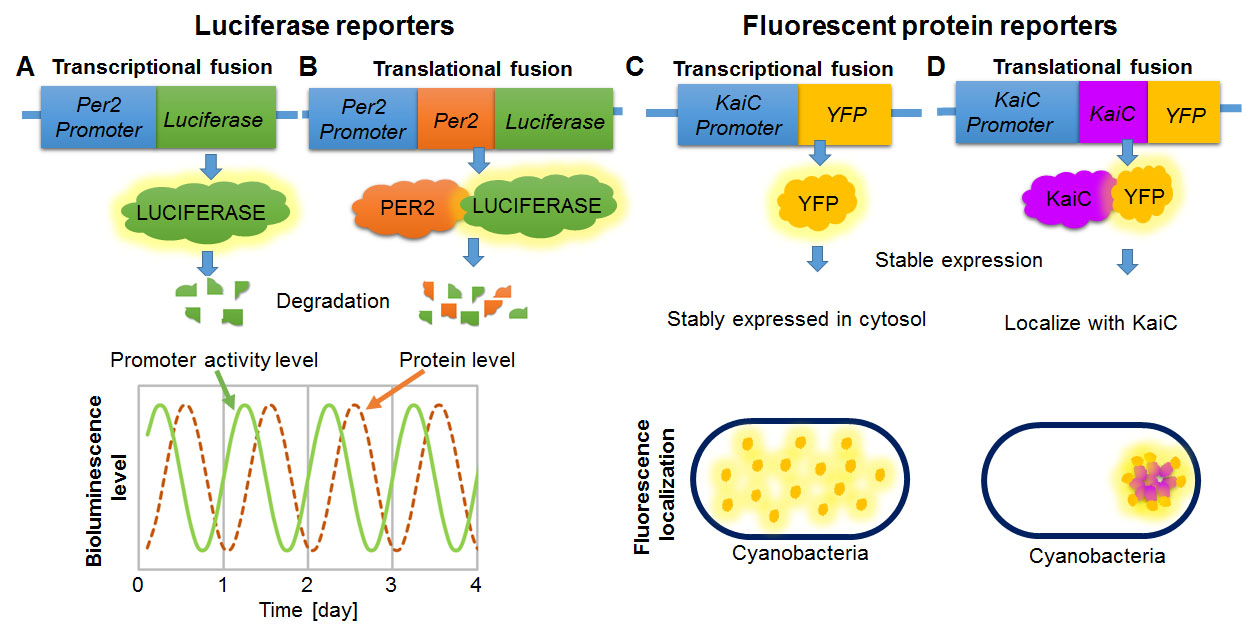
Figure 8. (A-B) Examples of luciferase gene fusion constructs to measure transcriptional (promoter) activity (parallel to mRNA expression) (A) and translational activity (parallel to protein expression) of a clock gene, Per2 (B). Degradation of luciferase is important to measure temporal changes of transcription or translation level. Without active degradation, the circadian trough would not be detectable. A schematic graph shows bioluminescence level obtained from transcriptional and translational fusion constructs of Per2. Note that promoter activity peaks hours before protein expression. (C-D) Examples of fluorescent reporter gene fusion constructs to visualize localization of control YFP (C), and KaiC, a clock protein in cyanobacteria (D). Fluorescent proteins are generally stably expressed in cytosol without large amount of degradation. When YFP is directly fused to promoter and not fused to localization signals (transcriptional fusion), it is expressed in cytosol (C). When YFP is fused to KaiC (translational fusion), it localize together with KaiC. Note that fluorescence intensity reports where YFP located, but do not necessary quantify the activity level of promoter (C) or fused protein level because YFP is stably expressed.
[Attribution and copyright information: These diagrams were generated by Takako Noguchi. CC BY 4.0.]
Spatiotemporal gene and protein quantification
Bioluminescence is very dim, but it is possible to capture single-cell level images (Welsh et al., 2004). Scientists perform spatiotemporal (“where and when”) gene expression or protein quantification (Fig. 7 iii, v) by imaging to study activities that are not evident from a summed output of a whole population. For example, synchronization among the SCN neurons was observed by imaging the SCN of a mouse expressing a luciferase under control of Per1 promoter (Yamaguchi et al., 2003). Images of the SCN of PER2::LUC mouse are shown in Fig. 5. Single fibroblasts were found to have independent clocks that can keep oscillating in constant conditions for over a month using PER2::LUC mouse fibroblasts (Welsh et al., 2004; Leise et al., 2012). Bioluminescence can also be measured in living rodents. For example, circadian rhythms in peripheral tissues in anesthetized PER2::LUC mice are monitored by in vivo imaging (Tahara et al., 2012), and even in free-moving mice (Saini et al., 2013). Per1-luc expression in the SCN is detected by an optic fiber in free-moving mice and rats (Yamaguchi et al., 2001; Yamaguchi et al., 2016).
One-timepoint gene and protein location
Fluorescent proteins are most commonly used for one-timepoint gene or protein location (Fig. 7vi, viii). This means that a sample is imaged once, but in some cases multiple samples are imaged over a time course to reconstruct dynamic changes. By introducing a construct that connects a promoter and the gene that encodes a fluorescent protein, scientists can locate the tissues or cells in the organism in which the gene is expressed. For example, neurons expressing clock genes were identified by Enhanced Green Fluorescent Protein (EGFP) using the GAL4-UAS system in fruit fly brains (Zhao et al., 2003). Nuclear entry of clock proteins or their complexes are studied by creating a fusion protein that consists of a clock protein and a fluorescent protein in mammalian cells (Vielhaber et al., 2000; Lee et al., 2015). Time-dependent localization of the cyanobacterial clock protein KaiC is studied by sampling cells from a population at different time points and imaging fluorescent fusion proteins (Cohen et al., 2014) (Fig. 6). One-timepoint gene expression or protein localization using fluorescent proteins produces similar results to immunohistochemical (IHC) staining, which locates proteins by antibodies often tagged with synthetic fluorescent molecules. Scientists often show combined fluorescent images of IHC and genetically encoded fluorescent reporters. In these cases, students have to carefully identify what the fluorescence represents.
Spatiotemporal gene quantification by fluorescent proteins
Spatiotemporal gene expression (Fig. 7vii) can be measured by destabilizing fluorescent proteins so that they do not accumulate and their expression levels better reflect recent synthesis. The genes that encode fluorescent proteins are modified to encode destabilization signal to the polypeptide that are recognized by protein degradation machinery, such as by fusing 2 PEST sequences (Kuhlman et al., 2000). For example, circadian Rev-Erbα promoter activity was imaged by destabilized Venus, a variant of YFP, in NIH3T3 cells, a mouse cell line (Nagoshi et al., 2004). Circadian Per1 promoter activity in the SCN was reported by destabilized EGFP (LeSauter et al., 2003) (Fig. 5A, C).
Variations of luciferase reporters
Luciferases have various characteristics depending on the purposes for which they evolved in the original organisms. Luciferases with different characteristics are commercially available as gene expression or protein reporters. The most commonly used luciferase reporter is North American firefly luciferase (FLuc). Modified luciferases with different properties are constantly being invented through genetic engineering to make experiments more efficient and easier. In this section, we introduce various types of luciferases and technologies using them.
Flash- and glow-type luciferases
There are luciferase reporters with different reaction kinetics. For example, “flash” type luciferase, such as the sea pansy Renilla luciferase (RLuc) and Gaussia luciferase (GLuc), generate high intensity bioluminescence in short time (within 10 s) (Bhaumik and Gambhir, 2002; Tannous, 2009). On the other hand, “glow” type luciferases, such as Fluc or bacterial luciferase (Lux) generate stable long-lasting bioluminescence (more than 30 min) (Andreu et al., 2010). Flash-type luciferase is a useful tool for one-timepoint quantification, but glow type is more suitable for the long-term recording required in circadian rhythm applications.
Calcium-sensitive luciferase
Aequorin, a calcium-sensitive luciferase, was isolated from the jellyfish Aequorea together with GFP (Shimomura et al., 1962, 1963). Aequorin uses the substrate coelenterazine (Granatiero et al., 2014a) and can measure wide range of calcium concentrations (0.1 -10 µM in natural form, up to 100 µM in mutated form) (Granatiero et al., 2014b). Aequorin was successfully applied to measure circadian calcium rhythms in living plants continuously (Johnson et al., 1995) and neuronal activity in free-moving zebrafish (Naumann et al., 2010). Aequorin has advantages in (1) wide dynamic range, (2) low background noise, (3) low calcium buffering, and (4) low toxicity. However, the disadvantages include (1) some properties of coelenterazine, such as less membrane permeability, less stability, and higher price than other luciferins, (2) the requirement of specialized detectors, and (3) a long reconstitution time of aequorin and coelenterazine complex. Because of these downsides, calcium measurements in circadian rhythm and other biological fields are mostly performed by calcium-sensitive dyes, such as Fra-2 and fluo-4, or GFP-based genetically encoded calcium indicators (GECIs) (Chen et al., 2013; Sun et al., 2013). Calcium-sensitive dyes are effective for short-term (within 1 h) recording (Colwell, 2000). GECIs are effective for long-term (more than a week or months) recording (Ikeda et al., 2003; Brancaccio et al., 2013).
Bioluminescence resonance energy transfer (BRET)
Purified aequorin emits blue light; however, the result is green light emitted by the jellyfish body. This difference happens because GFP naturally forms a complex with aequorin and energy generated by aequorin is transferred to GFP, which then emits fluorescence. This process is called Förster resonance energy transfer (FRET). Especially when a donor of energy is a luciferase, it is called bioluminescence resonance energy transfer (BRET) (Wilson and Hastings, 1998; Pfleger et al., 2006). BRET can occur when the donor and acceptor are very close (10-100 Å apart). During BRET, the energy from an excited electron in a donor molecule jumps to an electron in the acceptor molecule, exciting it without turning energy into photons in between; only the acceptor electron gives off light when it falls back to ground state. BRET happens in some luciferase and florescent protein pairs, such as RLuc and GFP (Wilson and Hastings, 1998). Changes in emission color by BRET can be used to test protein-protein interactions. In this assay, scientists can fuse one protein to a luciferase and the other protein to a fluorescent protein. When the two proteins interact (physically associate closely), the spectrum changes from shorter to longer wavelength (e.g., blue to green). For example, a protein interaction assay by BRET was first applied in the circadian rhythm field to study interaction between the cyanobacterial oscillator proteins KaiA and KaiB, and interacting subunits of KaiB itself (Xu et al., 1999).
Brighter luciferases
Dimness of signal is the major weakness of bioluminescent reporters. Bioengineers are making efforts to generate brighter luciferases. Recently introduced NanoLuc (Promega Madison, WI), derived from the deep sea shrimp Oplophorus gracilirostris, is ~150-fold brighter than FLuc and has glow-type kinetics. NanoLuc has been applied successfully to image nuclear entry of proteins (Hall et al., 2012). Application to circadian rhythm research has not yet been achieved. The other brighter luciferase ELuc (10-fold brighter than FLuc), derived from the click beetle Pyrearinus termitilluminans, was applied to image promoter activity of the clock gene, Bmal1, in the SCN as well as protein nuclear entry (Nakajima et al., 2010).
Color variations
Color spectra of luciferases are different depending on the organisms they are derived from or various chemical conditions. Fireflies exhibit green-yellow bioluminescence in nature, but purified FLuc exhibits green at pH 8, and red at pH 6. Higher temperature and the presence of heavy metal cations also red shift the spectrum of FLuc (Nakatsu et al., 2006; Viviani et al., 2008). Luciferases derived from other luminescent beetles use the same substrates as FLuc, D-luciferin, but are insensitive to pH, temperature, and heavy metal cations, and stably exhibit one color spectrum (Viviani et al., 2008). For example, stable red- or green-emitting luciferase derived from railroad worms and click beetles are available. In the circadian rhythm field, the expression patterns of two different clock genes that peak at different times of the day (Bmal1 and Per2) were monitored simultaneously using mice expressing red- and green-emitting luciferases (Noguchi et al., 2012). Luciferases derived from marine organisms often exhibit blue bioluminescence, as is true for Renilla and Gaussia, (Zhao et al., 2005; Viviani, 2007; Maguire et al., 2009).
Other luciferase reporters
Luciferases can be engineered to localize to the cytosol, nucleus, or other organelles by the addition of localization signals. Some luciferases such as Ostracod Cypridina noctiluca (CLuc), and Gaussia (GLuc) are naturally secreted proteins. In the circadian rhythm field, promoter activity of Per2 was monitored by secreted CLuc in the blood of rats (Yamada et al., 2013).
In the bacterial Vibrio harveyi luciferase (Lux) assay system, the substrate is a long-chain aldehyde, unrelated to invertebrate luciferins, which can be readily engineered to be expressed in the host organism along with the luciferase (Meighen, 1991; Shultzaberger et al., 2015). The co-expression of the luciferase LuxAB and its substrate enables bioluminescence monitoring without adding luciferin, and is often favored for circadian monitoring in cyanobacteria.
Variations of fluorescent protein reporters
A wide variety of reporters or sensors based on fluorescent proteins has been developed (Shaner et al., 2005). In this section, we introduce various fluorescent reporters used in circadian rhythms research.
Color variations
Expression of multiple genes can be analyzed simultaneously by using florescent proteins of different colors. Color variants of fluorescent proteins are either generated by mutating existing fluorescent proteins, such as GFP, or newly cloned from organisms exhibiting different fluorescent colors. There are many color variants, but common fluorescent proteins that exhibit red, yellow, green, cyan (blue), are generally called RFP, YFP, GFP, and CFP, respectively. Each color variant has its own name, such as mPlum emitting far-red, mCherry and DsRed emitting red, mOrange, mCitrine and Venus emitting yellow-green, Emerald and EGFP emitting green, and mCFPm and Cerulean emitting cyan (Shaner et al., 2005). For example, in circadian rhythm research, a transgenic mouse line expressing two fusion proteins, PER1-Venus and PER2-DsRED, was developed to locate and quantify the expression of PER1 and PER2 proteins in mouse brain (Cheng et al., 2009).
FRET
FRET (Förster resonance energy transfer, described above) happens between fluorescent protein pairs with different colors when they are in close distance. In this case, the word FRET could stand for fluorescent resonance energy transfer. When a donor of energy is a fluorescent molecule, an external light source must excite the donor, whose excited state is transferred to the acceptor, which then fluoresces. FRET can be used to study protein interactions similarly to BRET. For example, to study KaiC and KaiB interaction, scientists made KaiC-Cerulean and KaiB-Venus fusion proteins (Ma and Ranganathan, 2012). Cerulean itself is excited by 433 nm and emits at 475 nm. Venus itself is excited maximally by 515 nm (but can also absorb slightly shorter or longer wavelengths) and emits at 528 nm. But when KaiB and KaiC interact and bring Cerulean and Venus close, energy from 433 nm light is absorbed by Cerulean, transferred to Venus, and emitted as 528 nm light. Thus, scientists can tell that KaiB and KaiC interact by analyzing the emission color. If there were no interaction, the 433 nm excitation would result in only 475 nm emission (Fig. 9).
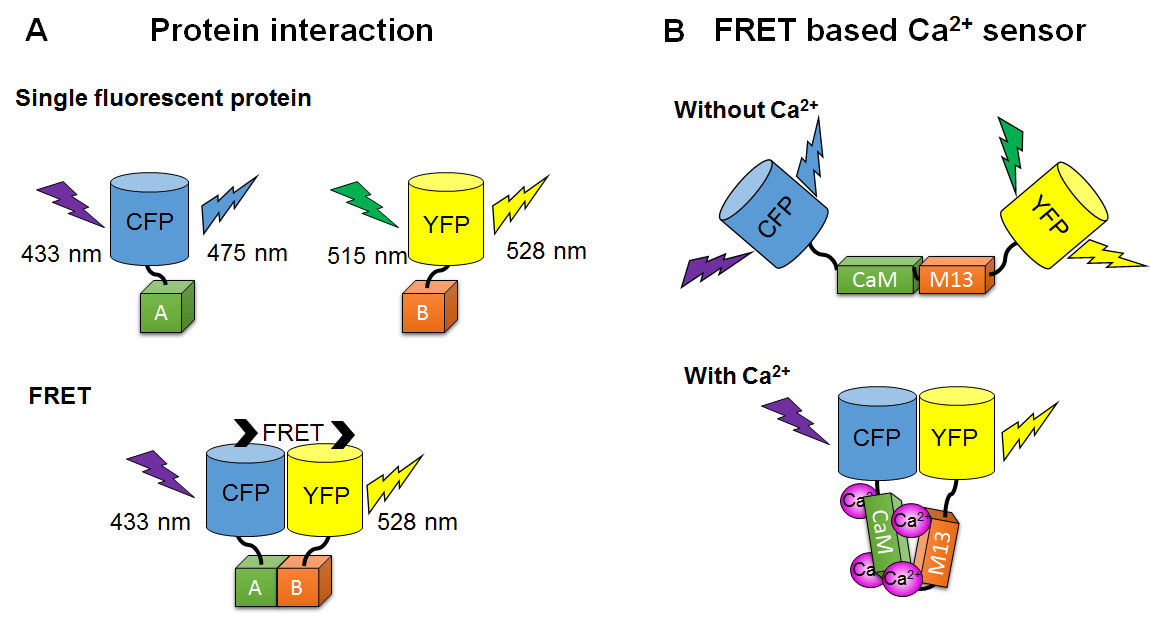
Figure 9. Schematic diagram of assays based on FRET. When two light-responsive proteins are very close, energy of the donor is transferred to excite the acceptor by FRET. (A) Protein interaction assay by FRET. CFP and YFP are tagged to protein A and B, respectively. Interaction between protein A and B can be detected by the emission color change. (B) FRET based Ca2+ sensor. FRET occurs only when a Ca2+ sensitive linker changes conformation by Ca2+ binding and bring two light-responsive proteins very close.
[Attribution and copyright information: These diagrams were generated by Takako Noguchi. CC BY 4.0.]
FRET-based small molecule sensors
The concentration of small molecules, such as Ca2+ or cyclic adenosine monophosphate (cAMP), can be measured by FRET-based sensors. Epac1-camps, a genetically encoded cAMP FRET sensor, is a chimeric protein of Epac (exchange proteins directly activated by cAMP) sandwiched between CFP and YFP (DiPilato et al., 2004; Ponsioen et al., 2004). FRET occurrence in Epac1-camps is reduced in the presence of cAMP because the two fluorescent protein components are pushed too far away from each other for energy transfer. For example, the cAMP response to a neurotransmitter in fly clock neurons was measured using Epac1-camps (Shafer et al., 2008). The Yellow Cameleons (YCs), genetically encoded calcium FRET sensors, are chimeric proteins of CFP and YFP linked by calcium-sensitive proteins, calmodulin (CaM), a glycylglycine linker, and CaM-binding domain of myosin light chain (M13) (Miyawaki et al., 1999; Russell, 2011; Horikawa, 2015). FRET occurrence increases in the presence of calcium because two fluorescent protein components are brought close when the CaM and M13 bind Ca2+. For example, circadian calcium rhythms can be imaged in cultured mouse SCNs (Ikeda et al., 2003; Enoki et al., 2012). These FRET-based sensors can respond to fast cellular events in millisecond timescales, such as the intracellular calcium concentration change triggered by a single action potential (Lutcke et al., 2010; Yamada et al., 2011). This is because they detect targeted molecules by conformation changes in pre-existing proteins, whereas the gene and protein expression reporters described above require transcription, translation, and degradation to respond to changes.
Single fluorescent protein-based sensors
Changes in calcium concentration can be measured by single fluorescent protein-based genetically encoded calcium sensors (GECIs), such as GCaMPs and Pericams (Horikawa, 2015). In this type of GECI, intensity of fluorescent protein emissions are modulated by calcium-binding modules (Tian et al., 2009; Chen et al., 2013). Fluorescent proteins are split into N and C terminal parts, then linked by CAM and M13 (N-CAM-M13-C), but the order of protein segments is circularly permuted (M13-C-N-CaM) so that the proximity of the N- and C-terminal protein domains is modulated by CaM (Baird et al., 1999). These GECIs are able to detect intracellular calcium concentration changes triggered by a single action potential (Lutcke et al., 2010; Yamada et al., 2011) as well as slow calcium changes as a summed effect of multiple action potentials or intracellular calcium stores. In the circadian rhythm field, slow cytosolic calcium changes over days are measured in mouse SCN or in fly clock neurons (Brancaccio et al., 2013; Liang et al., 2016).
Other fluorescent protein sensors
Single fluorescent protein-based voltage sensors have been developed to directly detect action potentials (Jin et al., 2012). In the circadian rhythm field, a single action potential was detected in Drosophila clock neurons using ArcLight (Cao et al., 2013).
Many other fluorescent protein-based genetically encoded sensors are available. For example, there are heme sensors (Hanna et al., 2016), redox sensors (Sugiura et al., 2015; Gibhardt et al., 2016), and extracellular glutamate sensors (Xie et al., 2016). These sensors may open new aspects of circadian biology to future investigation.
Conclusion
Bioluminescence reporters are highly quantitative and nontoxic tools that enable noninvasive long-term recording. In the circadian rhythm field, luciferases are frequently used to monitor temporal gene and protein quantification. Fluorescent reporters have high spatial resolution and are often used to visualize the sites of gene or protein expression and are less frequently used to quantify gene or protein expression. Fluorescent protein-based sensors are also useful tools to monitor circadian rhythms of small molecules, such as calcium.
References
Adams JU (2010) How Do Cells Decode Genetic Information into Functional Proteins? In: Essential of Cell Biology (O'Connor C, ed). Cambridge, MA: NPG Education. http://www.nature.com/scitable/ebooks/cell-biology-for-seminars-14760004/how-do-cells-decode-genetic-information-into-14760047
Andreu N, Zelmer A, Fletcher T, Elkington PT, Ward TH, Ripoll J, Parish T, Bancroft GJ, Schaible U, Robertson BD, Wiles S (2010) Optimisation of bioluminescent reporters for use with mycobacteria. PLoS One 5:e10777. http://www.ncbi.nlm.nih.gov/pubmed/20520722
Appelbaum L, Wang G, Yokogawa T, Skariah GM, Smith SJ, Mourrain P, Mignot E (2010) Circadian and homeostatic regulation of structural synaptic plasticity in hypocretin neurons. Neuron 68:87-98. http://www.ncbi.nlm.nih.gov/pubmed/20920793
Arnold KE, Owens IP, Marshall NJ (2002) Fluorescent signaling in parrots. Science 295:92. http://www.ncbi.nlm.nih.gov/pubmed/11778040
Arpino JA, Rizkallah PJ, Jones DD (2014) Structural and dynamic changes associated with beneficial engineered single-amino-acid deletion mutations in enhanced green fluorescent protein. Acta Crystallogr D Biol Crystallogr 70:2152-2162. http://www.ncbi.nlm.nih.gov/pubmed/25084334
Baird GS, Zacharias DA, Tsien RY (1999) Circular permutation and receptor insertion within green fluorescent proteins. Proc Natl Acad Sci U S A 96:11241-11246. http://www.ncbi.nlm.nih.gov/pubmed/10500161
Bhaumik S, Gambhir SS (2002) Optical imaging of Renilla luciferase reporter gene expression in living mice. Proc Natl Acad Sci U S A 99:377-382. http://www.ncbi.nlm.nih.gov/pubmed/11752410
Brancaccio M, Maywood ES, Chesham JE, Loudon AS, Hastings MH (2013) A Gq-Ca2+ axis controls circuit-level encoding of circadian time in the suprachiasmatic nucleus. Neuron 78:714-728. http://www.ncbi.nlm.nih.gov/pubmed/23623697
Brand AH, Perrimon N (1993) Targeted gene expression as a means of altering cell fates and generating dominant phenotypes. Development 118:401-415. http://www.ncbi.nlm.nih.gov/pubmed/8223268
Bushey D, Tononi G, Cirelli C (2015) Sleep- and wake-dependent changes in neuronal activity and reactivity demonstrated in fly neurons using in vivo calcium imaging. Proc Natl Acad Sci U S A 112:4785-4790. http://www.ncbi.nlm.nih.gov/pubmed/25825756
Cao G, Platisa J, Pieribone VA, Raccuglia D, Kunst M, Nitabach MN (2013) Genetically targeted optical electrophysiology in intact neural circuits. Cell 154:904-913. http://www.ncbi.nlm.nih.gov/pubmed/23932121
Chen TW, Wardill TJ, Sun Y, Pulver SR, Renninger SL, Baohan A, Schreiter ER, Kerr RA, Orger MB, Jayaraman V, Looger LL, Svoboda K, Kim DS (2013) Ultrasensitive fluorescent proteins for imaging neuronal activity. Nature 499:295-300. http://www.ncbi.nlm.nih.gov/pubmed/23868258
Cheng HY, Alvarez-Saavedra M, Dziema H, Choi YS, Li A, Obrietan K (2009) Segregation of expression of mPeriod gene homologs in neurons and glia: possible divergent roles of mPeriod1 and mPeriod2 in the brain. Hum Mol Genet 18:3110-3124. http://www.ncbi.nlm.nih.gov/pubmed/19477955
Choy G, O'Connor S, Diehn FE, Costouros N, Alexander HR, Choyke P, Libutti SK (2003) Comparison of noninvasive fluorescent and bioluminescent small animal optical imaging. Biotechniques 35:1022-1026, 1028-1030. http://www.ncbi.nlm.nih.gov/pubmed/14628676
Cohen SE, Golden SS (2015) Circadian Rhythms in Cyanobacteria. Microbiol Mol Biol Rev 79:373-385. http://www.ncbi.nlm.nih.gov/pubmed/26335718
Cohen SE, Erb ML, Selimkhanov J, Dong G, Hasty J, Pogliano J, Golden SS (2014) Dynamic localization of the cyanobacterial circadian clock proteins. Curr Biol 24:1836-1844. http://www.ncbi.nlm.nih.gov/pubmed/25127213
Colwell CS (2000) Circadian modulation of calcium levels in cells in the suprachiasmatic nucleus. Eur J Neurosci 12:571-576. http://www.ncbi.nlm.nih.gov/pubmed/10712636
Conchello JA, Lichtman JW (2005) Optical sectioning microscopy. Nat Methods 2:920-931. http://www.ncbi.nlm.nih.gov/pubmed/16299477
Darlington TK, Wager-Smith K, Ceriani MF, Staknis D, Gekakis N, Steeves TD, Weitz CJ, Takahashi JS, Kay SA (1998) Closing the circadian loop: CLOCK-induced transcription of its own inhibitors per and tim. Science 280:1599-1603. http://www.ncbi.nlm.nih.gov/pubmed/9616122
DiPilato LM, Cheng X, Zhang J (2004) Fluorescent indicators of cAMP and Epac activation reveal differential dynamics of cAMP signaling within discrete subcellular compartments. Proc Natl Acad Sci U S A 101:16513-16518. http://www.ncbi.nlm.nih.gov/pubmed/15545605
Dixit R, Cyr R (2003) Cell damage and reactive oxygen species production induced by fluorescence microscopy: effect on mitosis and guidelines for non-invasive fluorescence microscopy. Plant J 36:280-290. http://www.ncbi.nlm.nih.gov/pubmed/14535891
Drepper T, Eggert T, Circolone F, Heck A, Krauss U, Guterl JK, Wendorff M, Losi A, Gartner W, Jaeger KE (2007) Reporter proteins for in vivo fluorescence without oxygen. Nat Biotechnol 25:443-445. http://www.ncbi.nlm.nih.gov/pubmed/17351616
Enoki R, Kuroda S, Ono D, Hasan MT, Ueda T, Honma S, Honma K (2012) Topological specificity and hierarchical network of the circadian calcium rhythm in the suprachiasmatic nucleus. Proceedings of the National Academy of Sciences of the United States of America 109:21498-21503. http://www.ncbi.nlm.nih.gov/pubmed/23213253
Gandia-Herrero F, Garcia-Carmona F, Escribano J (2005) Botany: floral fluorescence effect. Nature 437:334. http://www.ncbi.nlm.nih.gov/pubmed/16163341
Gekakis N, Staknis D, Nguyen HB, Davis FC, Wilsbacher LD, King DP, Takahashi JS, Weitz CJ (1998) Role of the CLOCK protein in the mammalian circadian mechanism. Science 280:1564-1569. http://www.ncbi.nlm.nih.gov/pubmed/9616112
Gibhardt CS, Zimmermann KM, Zhang X, Belousov VV, Bogeski I (2016) Imaging calcium and redox signals using genetically encoded fluorescent indicators. Cell Calcium 10.1016/j.ceca.2016.04.008. http://www.ncbi.nlm.nih.gov/pubmed/27142890
Giloh H, Sedat JW (1982) Fluorescence microscopy: reduced photobleaching of rhodamine and fluorescein protein conjugates by n-propyl gallate. Science 217:1252-1255. http://www.ncbi.nlm.nih.gov/pubmed/7112126
Godley BF, Shamsi FA, Liang FQ, Jarrett SG, Davies S, Boulton M (2005) Blue light induces mitochondrial DNA damage and free radical production in epithelial cells. J Biol Chem 280:21061-21066. http://www.ncbi.nlm.nih.gov/pubmed/15797866
Granatiero V, Patron M, Tosatto A, Merli G, Rizzuto R (2014a) The use of aequorin and its variants for Ca2+ measurements. Cold Spring Harb Protoc 2014:9-16. http://www.ncbi.nlm.nih.gov/pubmed/24371311
Granatiero V, Patron M, Tosatto A, Merli G, Rizzuto R (2014b) Using targeted variants of aequorin to measure Ca2+ levels in intracellular organelles. Cold Spring Harb Protoc 2014:86-93. http://www.ncbi.nlm.nih.gov/pubmed/24371314
Hall MP, Unch J, Binkowski BF, Valley MP, Butler BL, Wood MG, Otto P, Zimmerman K, Vidugiris G, Machleidt T, Robers MB, Benink HA, Eggers CT, Slater MR, Meisenheimer PL, Klaubert DH, Fan F, Encell LP, Wood KV (2012) Engineered luciferase reporter from a deep sea shrimp utilizing a novel imidazopyrazinone substrate. ACS Chem Biol 7:1848-1857. http://www.ncbi.nlm.nih.gov/pubmed/22894855
Hamamatsu Photonics KK (2006) Photomultiplier Tubes: Basics and Applications, 3a Edition: Hamamatsu Photonics KK. https://www.hamamatsu.com/resources/pdf/etd/PMT_handbook_v3aE.pdf
Hanna DA, Harvey RM, Martinez-Guzman O, Yuan X, Chandrasekharan B, Raju G, Outten FW, Hamza I, Reddi AR (2016) Heme dynamics and trafficking factors revealed by genetically encoded fluorescent heme sensors. Proc Natl Acad Sci U S A 10.1073/pnas.1523802113. http://www.ncbi.nlm.nih.gov/pubmed/27247412
Horikawa K (2015) Recent progress in the development of genetically encoded Ca2+ indicators. J Med Invest 62:24-28. http://www.ncbi.nlm.nih.gov/pubmed/25817279
Ikeda M, Sugiyama T, Wallace CS, Gompf HS, Yoshioka T, Miyawaki A, Allen CN (2003) Circadian dynamics of cytosolic and nuclear Ca2+ in single suprachiasmatic nucleus neurons. Neuron 38:253-263. http://www.ncbi.nlm.nih.gov/pubmed/12718859
Jin L, Han Z, Platisa J, Wooltorton JR, Cohen LB, Pieribone VA (2012) Single action potentials and subthreshold electrical events imaged in neurons with a fluorescent protein voltage probe. Neuron 75:779-785. http://www.ncbi.nlm.nih.gov/pubmed/22958819
Johnson CH, Knight MR, Kondo T, Masson P, Sedbrook J, Haley A, Trewavas A (1995) Circadian oscillations of cytosolic and chloroplastic free calcium in plants. Science 269:1863-1865. http://www.ncbi.nlm.nih.gov/pubmed/7569925
Kitsera N, Khobta A, Epe B (2007) Destabilized green fluorescent protein detects rapid removal of transcription blocks after genotoxic exposure. Biotechniques 43:222-227. http://www.ncbi.nlm.nih.gov/pubmed/17824390
Kondo T, Tsinoremas NF, Golden SS, Johnson CH, Kutsuna S, Ishiura M (1994) Circadian clock mutants of cyanobacteria. Science 266:1233-1236. http://www.ncbi.nlm.nih.gov/pubmed/7973706
Kondo T, Strayer CA, Kulkarni RD, Taylor W, Ishiura M, Golden SS, Johnson CH (1993) Circadian rhythms in prokaryotes: luciferase as a reporter of circadian gene expression in cyanobacteria. Proc Natl Acad Sci U S A 90:5672-5676. http://www.ncbi.nlm.nih.gov/pubmed/8516317
Kuhlman SJ, Quintero JE, McMahon DG (2000) GFP fluorescence reports Period 1 circadian gene regulation in the mammalian biological clock. Neuroreport 11:1479-1482. http://www.ncbi.nlm.nih.gov/pubmed/10841361
Leclerc GM, Boockfor FR, Faught WJ, Frawley LS (2000) Development of a destabilized firefly luciferase enzyme for measurement of gene expression. Biotechniques 29:590-591, 594-596, 598 passim. http://www.ncbi.nlm.nih.gov/pubmed/10997273
Lee Y, Jang AR, Francey LJ, Sehgal A, Hogenesch JB (2015) KPNB1 mediates PER/CRY nuclear translocation and circadian clock function. Elife 4. http://www.ncbi.nlm.nih.gov/pubmed/26319354
Leise TL, Wang CW, Gitis PJ, Welsh DK (2012) Persistent cell-autonomous circadian oscillations in fibroblasts revealed by six-week single-cell imaging of PER2::LUC bioluminescence. PLoS One 7:e33334. http://www.ncbi.nlm.nih.gov/pubmed/22479387
LeSauter J, Yan L, Vishnubhotla B, Quintero JE, Kuhlman SJ, McMahon DG, Silver R (2003) A short half-life GFP mouse model for analysis of suprachiasmatic nucleus organization. Brain Research 964:279-287. https://www.ncbi.nlm.nih.gov/pubmed/12576188
Liang X, Holy TE, Taghert PH (2016) Synchronous Drosophila circadian pacemakers display nonsynchronous Ca(2)(+) rhythms in vivo. Science 351:976-981. http://www.ncbi.nlm.nih.gov/pubmed/26917772
Lichtman JW, Conchello JA (2005) Fluorescence microscopy. Nat Methods 2:910-919. http://www.ncbi.nlm.nih.gov/pubmed/16299476
Lutcke H, Murayama M, Hahn T, Margolis DJ, Astori S, Zum Alten Borgloh SM, Gobel W, Yang Y, Tang W, Kugler S, Sprengel R, Nagai T, Miyawaki A, Larkum ME, Helmchen F, Hasan MT (2010) Optical recording of neuronal activity with a genetically-encoded calcium indicator in anesthetized and freely moving mice. Front Neural Circuits 4:9. http://www.ncbi.nlm.nih.gov/pubmed/20461230
Ma L, Ranganathan R (2012) Quantifying the rhythm of KaiB-C interaction for in vitro cyanobacterial circadian clock. PLoS One 7:e42581. http://www.ncbi.nlm.nih.gov/pubmed/22900029
Maguire CA, Deliolanis NC, Pike L, Niers JM, Tjon-Kon-Fat LA, Sena-Esteves M, Tannous BA (2009) Gaussia luciferase variant for high-throughput functional screening applications. Anal Chem 81:7102-7106. http://www.ncbi.nlm.nih.gov/pubmed/19601604
Matz MV, Fradkov AF, Labas YA, Savitsky AP, Zaraisky AG, Markelov ML, Lukyanov SA (1999) Fluorescent proteins from nonbioluminescent Anthozoa species. Nat Biotechnol 17:969-973. http://www.ncbi.nlm.nih.gov/pubmed/10504696
Meighen EA (1991) Molecular biology of bacterial bioluminescence. Microbiol Rev 55:123-142. http://www.ncbi.nlm.nih.gov/pubmed/2030669
Millar AJ, Carre IA, Strayer CA, Chua NH, Kay SA (1995) Circadian clock mutants in Arabidopsis identified by luciferase imaging. Science 267:1161-1163. http://www.ncbi.nlm.nih.gov/pubmed/7855595
Miyawaki A, Griesbeck O, Heim R, Tsien RY (1999) Dynamic and quantitative Ca2+ measurements using improved cameleons. Proc Natl Acad Sci U S A 96:2135-2140. http://www.ncbi.nlm.nih.gov/pubmed/10051607
Mohawk JA, Green CB, Takahashi JS (2012) Central and peripheral circadian clocks in mammals. Annu Rev Neurosci 35:445-462. http://www.ncbi.nlm.nih.gov/pubmed/22483041
Morse D, Sassone-Corsi P (2002) Time after time: inputs to and outputs from the mammalian circadian oscillators. Trends Neurosci 25:632-637. http://www.ncbi.nlm.nih.gov/pubmed/12446131
Nagoshi E, Saini C, Bauer C, Laroche T, Naef F, Schibler U (2004) Circadian gene expression in individual fibroblasts: cell-autonomous and self-sustained oscillators pass time to daughter cells. Cell 119:693-705. http://www.ncbi.nlm.nih.gov/pubmed/15550250
Nakagawa A, Alt KV, Lillemoe KD, Castillo CF, Warshaw AL, Liss AS (2015) A method for fixing and paraffin embedding tissue to retain the natural fluorescence of reporter proteins. Biotechniques 59:153-155. http://www.ncbi.nlm.nih.gov/pubmed/26345508
Nakajima Y, Yamazaki T, Nishii S, Noguchi T, Hoshino H, Niwa K, Viviani VR, Ohmiya Y (2010) Enhanced beetle luciferase for high-resolution bioluminescence imaging. PLoS One 5:e10011. http://www.ncbi.nlm.nih.gov/pubmed/20368807
Nakatsu T, Ichiyama S, Hiratake J, Saldanha A, Kobashi N, Sakata K, Kato H (2006) Structural basis for the spectral difference in luciferase bioluminescence. Nature 440:372-376. http://www.ncbi.nlm.nih.gov/pubmed/16541080
Naumann EA, Kampff AR, Prober DA, Schier AF, Engert F (2010) Monitoring neural activity with bioluminescence during natural behavior. Nat Neurosci 13:513-520. http://www.ncbi.nlm.nih.gov/pubmed/20305645
Niswender KD, Blackman SM, Rohde L, Magnuson MA, Piston DW (1995) Quantitative imaging of green fluorescent protein in cultured cells: comparison of microscopic techniques, use in fusion proteins and detection limits. J Microsc 180:109-116. http://www.ncbi.nlm.nih.gov/pubmed/8537958
Noguchi T, Ikeda M, Ohmiya Y, Nakajima Y (2012) A dual-color luciferase assay system reveals circadian resetting of cultured fibroblasts by co-cultured adrenal glands. PLoS One 7:e37093. http://www.ncbi.nlm.nih.gov/pubmed/22615906
Oba Y, Schultz DT (2014) Eco-evo bioluminescence on land and in the sea. Adv Biochem Eng Biotechnol 144:3-36. http://www.ncbi.nlm.nih.gov/pubmed/25084993
Oliveira AG, Desjardin DE, Perry BA, Stevani CV (2012) Evidence that a single bioluminescent system is shared by all known bioluminescent fungal lineages. Photochem Photobiol Sci 11:848-852. http://www.ncbi.nlm.nih.gov/pubmed/22495263
Peters AJ, Chen SX, Komiyama T (2014) Emergence of reproducible spatiotemporal activity during motor learning. Nature 510:263-267. http://www.ncbi.nlm.nih.gov/pubmed/24805237
Pfleger KD, Seeber RM, Eidne KA (2006) Bioluminescence resonance energy transfer (BRET) for the real-time detection of protein-protein interactions. Nat Protoc 1:337-345. http://www.ncbi.nlm.nih.gov/pubmed/17406254
Ponsioen B, Zhao J, Riedl J, Zwartkruis F, van der Krogt G, Zaccolo M, Moolenaar WH, Bos JL, Jalink K (2004) Detecting cAMP-induced Epac activation by fluorescence resonance energy transfer: Epac as a novel cAMP indicator. EMBO Rep 5:1176-1180. http://www.ncbi.nlm.nih.gov/pubmed/15550931
Promega Corporation (2000) Technical Bulletin: Luciferase assay system Promega Corporation. https://www.promega.com/-/media/files/resources/protocols/technical-bulletins/0/luciferase-assay-system-protocol.pdf
Purtov KV, Petushkov VN, Baranov MS, Mineev KS, Rodionova NS, Kaskova ZM, Tsarkova AS, Petunin AI, Bondar VS, Rodicheva EK, Medvedeva SE, Oba Y, Oba Y, Arseniev AS, Lukyanov S, Gitelson JI, Yampolsky IV (2015) The Chemical Basis of Fungal Bioluminescence. Angew Chem Int Ed Engl 54:8124-8128. http://www.ncbi.nlm.nih.gov/pubmed/26094784
Russell JT (2011) Imaging calcium signals in vivo: a powerful tool in physiology and pharmacology. Br J Pharmacol 163:1605-1625. http://www.ncbi.nlm.nih.gov/pubmed/20718728
Sacchetti A, Cappetti V, Marra P, Dell'Arciprete R, El Sewedy T, Crescenzi C, Alberti S (2001) Green fluorescent protein variants fold differentially in prokaryotic and eukaryotic cells. J Cell Biochem Suppl Suppl 36:117-128. http://www.ncbi.nlm.nih.gov/pubmed/11455577
Saini C, Liani A, Curie T, Gos P, Kreppel F, Emmenegger Y, Bonacina L, Wolf JP, Poget YA, Franken P, Schibler U (2013) Real-time recording of circadian liver gene expression in freely moving mice reveals the phase-setting behavior of hepatocyte clocks. Genes Dev 27:1526-1536. http://www.ncbi.nlm.nih.gov/pubmed/23824542
Salih A, Larkum A, Cox G, Kuhl M, Hoegh-Guldberg O (2000) Fluorescent pigments in corals are photoprotective. Nature 408:850-853. http://www.ncbi.nlm.nih.gov/pubmed/11130722
Sauer B (1998) Inducible gene targeting in mice using the Cre/lox system. Methods 14:381-392. http://www.ncbi.nlm.nih.gov/pubmed/9608509
Shafer OT, Kim DJ, Dunbar-Yaffe R, Nikolaev VO, Lohse MJ, Taghert PH (2008) Widespread receptivity to neuropeptide PDF throughout the neuronal circadian clock network of Drosophila revealed by real-time cyclic AMP imaging. Neuron 58:223-237. http://www.ncbi.nlm.nih.gov/pubmed/18439407
Shaner NC, Steinbach PA, Tsien RY (2005) A guide to choosing fluorescent proteins. Nat Methods 2:905-909. http://www.ncbi.nlm.nih.gov/pubmed/16299475
Shimomura O (2006) Bioluminescence Chemical Principles and Methods Preface. Bioluminescence: Chemical Principles and Methods. http://www.worldscientific.com/worldscibooks/10.1142/6102
Shimomura O, Johnson FH, Saiga Y (1962) Extraction, purification and properties of aequorin, a bioluminescent protein from the luminous hydromedusan, Aequorea. J Cell Comp Physiol 59:223-239. http://www.ncbi.nlm.nih.gov/pubmed/13911999
Shimomura O, Johnson FH, Saiga Y (1963) Further Data on the Bioluminescent Protein, Aequorin. J Cell Physiol 62:1-8. http://www.ncbi.nlm.nih.gov/pubmed/14051831
Shultzaberger RK, Paddock ML, Katsuki T, Greenspan RJ, Golden SS (2015) High-throughput and quantitative approaches for measuring circadian rhythms in cyanobacteria using bioluminescence. Methods Enzymol 551:53-72. http://www.ncbi.nlm.nih.gov/pubmed/25662451
Sparks JS, Schelly RC, Smith WL, Davis MP, Tchernov D, Pieribone VA, Gruber DF (2014) The covert world of fish biofluorescence: a phylogenetically widespread and phenotypically variable phenomenon. PLoS One 9:e83259. http://www.ncbi.nlm.nih.gov/pubmed/24421880
Sugiura K, Nagai T, Nakano M, Ichinose H, Nakabayashi T, Ohta N, Hisabori T (2015) Redox sensor proteins for highly sensitive direct imaging of intracellular redox state. Biochem Biophys Res Commun 457:242-248. http://www.ncbi.nlm.nih.gov/pubmed/25592971
Sun XR, Badura A, Pacheco DA, Lynch LA, Schneider ER, Taylor MP, Hogue IB, Enquist LW, Murthy M, Wang SS (2013) Fast GCaMPs for improved tracking of neuronal activity. Nat Commun 4:2170. http://www.ncbi.nlm.nih.gov/pubmed/23863808
Sundlov JA, Fontaine DM, Southworth TL, Branchini BR, Gulick AM (2012) Crystal structure of firefly luciferase in a second catalytic conformation supports a domain alternation mechanism. Biochemistry 51:6493-6495. http://www.ncbi.nlm.nih.gov/pubmed/22852753
Tahara Y, Kuroda H, Saito K, Nakajima Y, Kubo Y, Ohnishi N, Seo Y, Otsuka M, Fuse Y, Ohura Y, Komatsu T, Moriya Y, Okada S, Furutani N, Hirao A, Horikawa K, Kudo T, Shibata S (2012) In vivo monitoring of peripheral circadian clocks in the mouse. Curr Biol 22:1029-1034. http://www.ncbi.nlm.nih.gov/pubmed/22578421
Tannous BA (2009) Gaussia luciferase reporter assay for monitoring biological processes in culture and in vivo. Nat Protoc 4:582-591. http://www.ncbi.nlm.nih.gov/pubmed/19373229
Tian L, Hires SA, Mao T, Huber D, Chiappe ME, Chalasani SH, Petreanu L, Akerboom J, McKinney SA, Schreiter ER, Bargmann CI, Jayaraman V, Svoboda K, Looger LL (2009) Imaging neural activity in worms, flies and mice with improved GCaMP calcium indicators. Nat Methods 6:875-881. http://www.ncbi.nlm.nih.gov/pubmed/19898485
Tosches MA, Bucher D, Vopalensky P, Arendt D (2014) Melatonin signaling controls circadian swimming behavior in marine zooplankton. Cell 159:46-57. http://www.ncbi.nlm.nih.gov/pubmed/25259919
Vielhaber E, Eide E, Rivers A, Gao ZH, Virshup DM (2000) Nuclear entry of the circadian regulator mPER1 is controlled by mammalian casein kinase I epsilon. Mol Cell Biol 20:4888-4899. http://www.ncbi.nlm.nih.gov/pubmed/10848614
Viviani V (2007) TERRESTRIAL BIOLUMINESCENCE. In: Photobiological sciences online (American Society for Photobiology., ed), p 1 online resource. McLean, VA: American Society for Photobiology. http://photobiology.info/Viviani.html
Viviani VR, Arnoldi FG, Neto AJ, Oehlmeyer TL, Bechara EJ, Ohmiya Y (2008) The structural origin and biological function of pH-sensitivity in firefly luciferases. Photochem Photobiol Sci 7:159-169. http://www.ncbi.nlm.nih.gov/pubmed/18264583
Vukusic P, Hooper I (2005) Directionally controlled fluorescence emission in butterflies. Science 310:1151. http://www.ncbi.nlm.nih.gov/pubmed/16293753
Welsh DK, Noguchi T (2012) Cellular bioluminescence imaging. Cold Spring Harb Protoc 2012. http://www.ncbi.nlm.nih.gov/pubmed/22854570
Welsh DK, Yoo SH, Liu AC, Takahashi JS, Kay SA (2004) Bioluminescence imaging of individual fibroblasts reveals persistent, independently phased circadian rhythms of clock gene expression. Curr Biol 14:2289-2295. http://www.ncbi.nlm.nih.gov/pubmed/15620658
White J, Stelzer E (1999) Photobleaching GFP reveals protein dynamics inside live cells. Trends Cell Biol 9:61-65. http://www.ncbi.nlm.nih.gov/pubmed/10087620
Wilson T, Hastings JW (1998) Bioluminescence. Annu Rev Cell Dev Biol 14:197-230. http://www.ncbi.nlm.nih.gov/pubmed/9891783
Xie Y, Chan AW, McGirr A, Xue S, Xiao D, Zeng H, Murphy TH (2016) Resolution of High-Frequency Mesoscale Intracortical Maps Using the Genetically Encoded Glutamate Sensor iGluSnFR. J Neurosci 36:1261-1272. http://www.ncbi.nlm.nih.gov/pubmed/26818514
Xu Y, Piston DW, Johnson CH (1999) A bioluminescence resonance energy transfer (BRET) system: application to interacting circadian clock proteins. Proc Natl Acad Sci U S A 96:151-156. http://www.ncbi.nlm.nih.gov/pubmed/9874787
Yamada Y, Nishide SY, Nakajima Y, Watanabe T, Ohmiya Y, Honma K, Honma S (2013) Monitoring circadian time in rat plasma using a secreted Cypridina luciferase reporter. Anal Biochem 439:80-87. http://www.ncbi.nlm.nih.gov/pubmed/23624321
Yamada Y, Michikawa T, Hashimoto M, Horikawa K, Nagai T, Miyawaki A, Hausser M, Mikoshiba K (2011) Quantitative comparison of genetically encoded Ca indicators in cortical pyramidal cells and cerebellar Purkinje cells. Front Cell Neurosci 5:18. http://www.ncbi.nlm.nih.gov/pubmed/21994490
Yamaguchi S, Isejima H, Matsuo T, Okura R, Yagita K, Kobayashi M, Okamura H (2003) Synchronization of cellular clocks in the suprachiasmatic nucleus. Science 302:1408-1412. http://www.ncbi.nlm.nih.gov/pubmed/14631044
Yamaguchi S, Kobayashi M, Mitsui S, Ishida Y, van der Horst GT, Suzuki M, Shibata S, Okamura H (2001) View of a mouse clock gene ticking. Nature 409:684. http://www.ncbi.nlm.nih.gov/pubmed/11217850
Yamaguchi Y, Okada K, Mizuno T, Ota T, Yamada H, Doi M, Kobayashi M, Tei H, Shigeyoshi Y, Okamura H (2016) Real-Time Recording of Circadian Per1 and Per2 Expression in the Suprachiasmatic Nucleus of Freely Moving Rats. J Biol Rhythms 31:108-111. http://www.ncbi.nlm.nih.gov/pubmed/26656624
Yoo SH, Ko CH, Lowrey PL, Buhr ED, Song EJ, Chang S, Yoo OJ, Yamazaki S, Lee C, Takahashi JS (2005) A noncanonical E-box enhancer drives mouse Period2 circadian oscillations in vivo. Proc Natl Acad Sci U S A 102:2608-2613. http://www.ncbi.nlm.nih.gov/pubmed/15699353
Zhang L, Gase K, Baldwin I, Galis I (2010) Enhanced fluorescence imaging in chlorophyll-suppressed tobacco tissues using virus-induced gene silencing of the phytoene desaturase gene. Biotechniques 48:125-133. http://www.ncbi.nlm.nih.gov/pubmed/20359296
Zhao H, Doyle TC, Coquoz O, Kalish F, Rice BW, Contag CH (2005) Emission spectra of bioluminescent reporters and interaction with mammalian tissue determine the sensitivity of detection in vivo. J Biomed Opt 10:41210. http://www.ncbi.nlm.nih.gov/pubmed/16178634
Zhao J, Kilman VL, Keegan KP, Peng Y, Emery P, Rosbash M, Allada R (2003) Drosophila clock can generate ectopic circadian clocks. Cell 113:755-766. http://www.ncbi.nlm.nih.gov/pubmed/12809606
Zipfel WR, Williams RM, Webb WW (2003) Nonlinear magic: multiphoton microscopy in the biosciences. Nat Biotechnol 21:1369-1377. http://www.ncbi.nlm.nih.gov/pubmed/14595365